
Power BI vs Advanced Excel: What Should Beginners Learn First?
Power BI vs Advanced Excel: What Should Beginners Learn First? Data is now an important part of almost every business. Companies use sales figures, customer
 Skip to content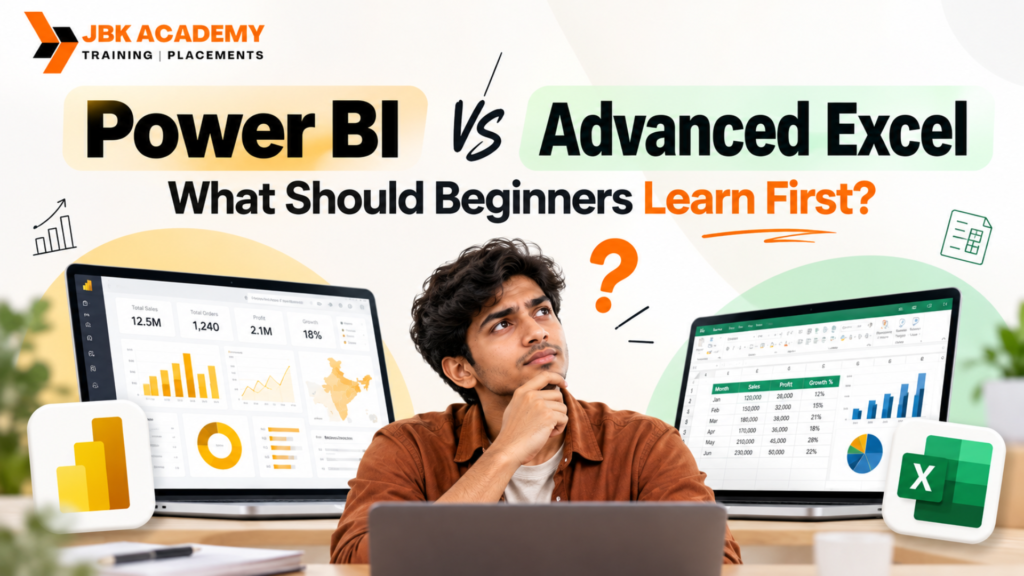
Data is now an important part of almost every business. Companies use sales figures, customer information, financial records, employee data, marketing results, inventory reports, and operational metrics to understand performance and make business decisions. As the amount of information increases, professionals need reliable data analysis tools to organize, analyze, visualize, and communicate information effectively. This is why beginners often come across two popular options: Excel and Power BI.
When comparing a Power BI Course vs Advanced Excel Course, beginners may wonder which one they should learn first. Both tools are useful, but they are designed for somewhat different purposes. Excel is widely used for calculations, data organization, formulas, analysis, and reporting, while Power BI is primarily designed for interactive data visualization, dashboards, data modeling, and business intelligence.
For students and working professionals considering a Power BI and Advanced Excel course in Hyderabad, understanding the difference between these two technologies can make the learning path much clearer. At JBK Academy, learners can explore both Excel and Power BI as part of a practical data analytics skill set rather than treating them as competing technologies.
The basic difference between Excel and Power BI is how they handle data and reporting. Excel is a spreadsheet-based application where users can enter, organize, calculate, analyze, and visualize data. Power BI is a business intelligence platform designed to connect to different data sources, transform information, create data models, and build interactive reports.
A Power BI Course vs Advanced Excel Course comparison therefore depends on what you want to accomplish. If you need to perform calculations, work with spreadsheets, clean smaller datasets, create formulas, or prepare traditional reports, Advanced Excel provides a strong foundation. If you need interactive dashboards, multiple data sources, automated reporting, and large-scale visualization, Power BI becomes increasingly useful.
This does not mean that one tool completely replaces the other. In many professional environments, Excel and Power BI are used together. Someone who completes an Advanced Excel Course in Hyderabad may later add Power BI to expand their reporting and analytics capabilities.
Yes, learning Excel before Power BI can be helpful for beginners, especially if they have little or no experience with data analysis. However, Excel is not an absolute prerequisite for learning Power BI.
The answer to the question “Should I learn Excel before Power BI?” depends on your background and career goal. Excel helps beginners understand fundamental concepts such as rows, columns, tables, formulas, filtering, sorting, calculations, and data organization. These concepts can make it easier to understand data when moving into Power BI.
For someone completely new to analytics, starting with an Advanced Excel Course in Hyderabad can provide a comfortable introduction to working with business data. After building that foundation, learners can progress toward Power BI dashboards, data modeling, and interactive reporting.
However, someone who already has spreadsheet experience can start Power BI directly. A beginner who knows basic Excel does not necessarily need to spend months mastering every advanced Excel feature before beginning Power BI.
Excel has been used across businesses for many years because it is flexible and accessible. It can be used for budgeting, financial analysis, sales tracking, inventory management, project tracking, employee records, calculations, and reporting.An Advanced Excel Course in Hyderabad can teach learners how to move beyond basic data entry and use Excel as an effective analytical tool. Advanced features may include formulas, functions, PivotTables, charts, conditional formatting, data validation, lookup functions, and data-cleaning techniques.
Excel dashboards can also provide a simple way to summarize important business information. For example, a sales manager can use an Excel dashboard to monitor monthly sales, product performance, regional performance, and salesperson results.For this reason, Excel remains an important skill even for people who eventually want to specialize in Power BI. A strong understanding of spreadsheets can help professionals understand how business data is structured before they begin working with more advanced data analysis tools.
An Advanced Excel course generally goes beyond basic formulas and spreadsheet operations. Learners can explore functions and techniques that are useful for analyzing real-world business information.
Important topics can include:
The exact curriculum varies between training providers. For students searching for an Advanced Excel Course in Hyderabad, it is useful to choose a curriculum that includes practical exercises rather than focusing only on individual formulas.
At JBK Academy, learners interested in Excel and Power BI can approach these technologies as complementary skills. Learning how to analyze information in Excel before moving into interactive reporting can make the overall learning process easier to understand.
Power BI is a business intelligence and data visualization platform used to connect to data, transform it, model it, analyze it, and present it through interactive reports and dashboards.Unlike a traditional spreadsheet, Power BI is designed specifically around business intelligence workflows. A Power BI Course vs Advanced Excel Course comparison therefore becomes particularly relevant when the learner wants to understand modern reporting environments.Power BI can connect with different sources such as Excel files, databases, online services, and other supported data sources. Data can then be cleaned and transformed before being used to create reports.This makes Power BI useful for organizations where information is stored across multiple sources and decision-makers need a centralized view of important business metrics.
A Power BI course can cover several areas of the business intelligence process.
Typical topics may include:
For someone searching for Power BI Training Institute in Hyderabad, it is important to understand that learning Power BI is not only about creating colorful charts. A good learning path should explain how raw information is transformed into meaningful reports.
One of the most common questions in the Power BI Course vs Advanced Excel Course discussion is the difference between Excel dashboards and Power BI dashboards.Excel dashboards are generally built using spreadsheet features such as PivotTables, charts, formulas, slicers, and conditional formatting. They can be highly useful for smaller reporting requirements and for users who already work heavily with Excel.Power BI dashboards and reports are designed around interactive business intelligence. Users can combine multiple datasets, create relationships, apply filters, and interact with visualizations to explore information.For example, an Excel dashboard may contain monthly sales information and charts showing product performance. A Power BI report can connect sales information with customer, product, location, and date tables and allow users to explore those relationships interactively.Neither approach is automatically suitable for every situation. The right choice depends on the size of the dataset, reporting requirements, data sources, level of interaction, and organizational workflow.
Both Excel and Power BI can be used for data analysis, but their strengths are different.
Excel is particularly useful when users need direct control over individual calculations and spreadsheet-based analysis. It allows users to inspect cells, create formulas, manipulate tables, and perform quick calculations.
Power BI is more suitable when the goal is to build reusable reports and interactive visualizations from structured datasets. Instead of manually preparing the same report every month, a Power BI workflow can be designed around connected data and reusable report structures.
For learners interested in data analysis tools, understanding both technologies can therefore be more valuable than choosing only one.
A Power BI Course vs Advanced Excel Course should not always be viewed as an either-or decision. In many careers, Excel provides the foundation while Power BI adds advanced reporting and visualization capabilities.
Beginners should consider Advanced Excel first when they have limited experience working with data or spreadsheets. For example, students who are unfamiliar with formulas, tables, filtering, PivotTables, or basic data analysis may find Power BI difficult if they jump directly into advanced reporting concepts. An Advanced Excel Course in Hyderabad can help such learners understand the fundamentals of structured data. Once they become comfortable with tables, calculations, PivotTables, and charts, moving into Power BI becomes easier. Excel can also be particularly useful for students interested in finance, accounting, administration, sales, operations, HR, and business reporting because these areas commonly involve spreadsheet-based work.
Power BI may be a suitable starting point for learners who already understand basic Excel or who specifically want to move toward business intelligence and dashboard development. For example, someone who already knows how to create tables, use formulas, filter data, and work with spreadsheets can begin learning Power BI without first completing an advanced Excel curriculum. A Power BI Course vs Advanced Excel Course decision can therefore be based on existing knowledge. If you already use Excel regularly, Power BI can be added as a natural next step. For learners searching for Excel Power BI training in Ameerpet, learning both technologies together can also provide a broader introduction to business reporting and analytics.
One of the biggest advantages of learning both technologies is that they can work together. Excel files are commonly used as data sources for Power BI. A business may maintain sales records in Excel while using Power BI to create management reports and interactive visualizations.
This means that an employee who understands both Excel and Power BI can work across different parts of the reporting process.
For example:
Excel → Data Preparation → Power BI → Data Model → Dashboard → Business Report
This workflow demonstrates why the Power BI Course vs Advanced Excel Course comparison should not necessarily result in choosing only one technology.
Excel is used across a wide range of professional roles. Knowledge of advanced Excel can be useful in areas such as accounting, finance, sales, HR, administration, operations, project management, and business reporting.Power BI is particularly relevant to roles involving business intelligence, data reporting, analytics, and dashboard development.Learning both can expand the range of tasks a professional can handle.For example, a reporting professional may use Excel to prepare or validate information and Power BI to build interactive reports for management.For students looking for a Power BI Training Institute in Hyderabad, combining Power BI with strong Excel knowledge can therefore create a broader technical foundation than learning dashboard visualization alone.
Advanced Excel can be particularly useful for:
An Advanced Excel Course in Hyderabad can be a practical choice for anyone who regularly works with spreadsheets and wants to improve their data handling and reporting skills.
Power BI can be useful for:
For people already comfortable with Excel, learning Power BI can be a logical next step toward more interactive reporting.
For a complete beginner, a practical learning sequence can look like this:
Step 1: Excel Fundamentals
Start with spreadsheet basics, data entry, formatting, sorting, filtering, tables, and simple formulas.
Step 2: Advanced Excel
Move into advanced formulas, PivotTables, charts, data cleaning, and Excel dashboards.
Step 3: Data Analysis Concepts
Learn how to interpret data, identify trends, compare metrics, and communicate findings.
Step 4: Power Query
Understand how data can be imported, cleaned, transformed, and prepared.
Step 5: Power BI
Learn data connections, Power Query, data modeling, visualizations, DAX, reports, and Power BI dashboards.
Step 6: Practical Projects
Create projects using sales, finance, marketing, HR, or operations datasets.
This sequence gives beginners a structured route from spreadsheet-based analysis toward business intelligence.
Should I learn Excel before Power BI?
Yes, Excel can be a useful starting point for beginners because it introduces important concepts such as tables, formulas, filtering, calculations, and data organization. However, you do not need to master Advanced Excel before beginning Power BI. If you already have basic spreadsheet knowledge, you can start Power BI directly.
Is Power BI better than Excel?
Power BI and Excel serve different purposes. Excel is highly useful for spreadsheet-based calculations, analysis, and reporting, while Power BI is designed for business intelligence, interactive reports, data modeling, and dashboards. The right choice depends on the task.
Is Advanced Excel enough for a data analytics career?
Advanced Excel provides valuable analytical and reporting skills, but many modern analytics roles may require additional tools depending on the job. Learning Power BI alongside Excel can expand your capabilities in data visualization and business intelligence.
Can I learn Power BI without Excel?
Yes. Power BI can be learned without advanced Excel knowledge. However, basic spreadsheet and data concepts can make the learning process easier for beginners.
Which is easier, Excel or Power BI?
Excel is generally easier for complete beginners because its spreadsheet structure is familiar and straightforward. Power BI introduces additional concepts such as data modeling, relationships, Power Query, and DAX.
Are Excel dashboards still useful?
Yes. Excel dashboards can be useful for many reporting requirements, especially when data is relatively manageable and users are already working within Excel. Power BI becomes more useful when interactive reporting, multiple data sources, and business intelligence workflows are required.
Is Power BI difficult for beginners?
Power BI has a learning curve because it includes data transformation, modeling, visualization, and DAX. However, beginners can learn it progressively by starting with simple datasets and practical projects.
Can Excel and Power BI be used together?
Yes. Excel and Power BI can complement each other. Excel files can be used as data sources for Power BI, while Power BI can transform and visualize the information through interactive reports.
Which course should students take first?
Students with no spreadsheet or data analysis experience can start with Excel fundamentals and then move toward Advanced Excel and Power BI. Students who already know Excel can begin Power BI sooner.
The question of Power BI Course vs Advanced Excel Course does not have one answer for every learner. Both technologies have important roles in data analysis and reporting, but they solve different problems.Advanced Excel provides a strong foundation in spreadsheet-based analysis, formulas, data organization, PivotTables, charts, and Excel dashboards. Power BI extends the reporting process with data transformation, data modeling, interactive visualization, and Power BI dashboards.For someone completely new to analytics, learning Excel first can provide a strong foundation. For someone who already works comfortably with spreadsheets, Power BI can be the next step toward business intelligence and interactive reporting.The most practical long-term approach for many beginners is to learn both. An Advanced Excel Course in Hyderabad can establish fundamental data-handling skills, while Power BI training can introduce modern dashboard and business intelligence workflows.
Learners searching for a Power BI and Advanced Excel course in Hyderabad can therefore consider a combined learning path rather than treating the two technologies as competitors. For students and professionals in Ameerpet, Excel Power BI training in Ameerpet can provide an opportunity to develop both spreadsheet and dashboard skills within one broader data analytics journey.At JBK Academy, learners can explore Excel and Power BI with a focus on practical application. Whether your goal is to improve your current reporting skills, create professional dashboards, or move toward data analytics, understanding both tools can give you a more versatile foundation for working with business data.The key is not simply deciding between Excel and Power BI. The more important question is understanding when to use each tool, how they work together, and how to apply them to real business problems.
Power BI vs Advanced Excel: What Should Beginners Learn First? Data is now an important part of almost every business. Companies use sales figures, customer
Tally Course for Beginners: Step-by-Step Roadmap to Learn Accounting Software Learning accounting software can be an important step for students, job seekers, business owners, and
Job-Oriented Accounting Course in Ameerpet: What Students Should Check Before Joining Choosing a job oriented accounting course in Ameerpet is an important decision for students,
Best Computer Courses for Accounting Jobs in Hyderabad If you are looking for an accounting job in Hyderabad, knowing basic computer skills is no longer
Photoshop Course in Hyderabad: Beginner Roadmap for Design and Marketing Photoshop is one of the most widely recognized tools in the creative industry. From social
YouTube Video Editing Course: Skills Needed for Content Creators Creating videos for YouTube is no longer only about recording good footage. Successful creators need to
Video Editing Course in Hyderabad: Skills, Software and Career Opportunities Video has become one of the most powerful forms of digital communication. From YouTube videos
Graphic Designing Course in Hyderabad: Tools, Portfolio and Career Scope Choosing the right graphic designing course in Hyderabad can be an important first step for
Digital Marketing Course in Hyderabad: SEO, Google Ads and Social Media Career Path Choosing the right Digital Marketing course in Hyderabad can be an important
Tally vs Advanced Excel vs SAP FICO vs Power BI: Which Course Should You Choose? Choosing between Tally, Advanced Excel, SAP FICO, and Power BI
Accounting Course for Career Gap Candidates and Homemakers: Restart Roadmap Returning to work after a career break can feel challenging, especially when technology, workplace expectations,
MS Office Course in Ameerpet: Basic Computer Skills for Office Jobs In today’s workplace, basic computer knowledge is no longer an optional skill. Whether you
ITR and GST Tax Practitioner Course: How to Start a Tax Filing Career Taxation is an essential part of every business and financial system. Individuals
SAP FICO After Tally: Best Learning Path for Accountants For students and accounting professionals planning to build a career in finance, learning Tally first and
Zoho Books Course in Hyderabad: Cloud Accounting Skills for Freshers The shift from traditional accounting to cloud-based financial management has created new opportunities for students,
Advanced Excel and Tally Course: Best Skill Combination for Accounting Jobs Accounting has evolved significantly over the past decade. Businesses no longer rely solely on
Best Accounting Courses After 12th or Graduation in Hyderabad Start Your Career with the Best Accounting Course in Hyderabad Choosing the right career after completing
Tally Prime with GST Course: Complete Practical Syllabus for Beginners Accounting is one of the most stable and in-demand career fields in today’s business world.
Power BI Course for Accounting and Finance Students: Dashboard Skills Roadmap Introduction to Power BI Overview of Power BI and its capabilities. Installation and setup
SAP FICO Course in Ameerpet Hyderabad: Syllabus, Eligibility and Jobs Finance departments are rapidly adopting enterprise resource planning systems to manage accounting, taxation, cost control,