
What Is Power BI and How Is It Used in Data Analytics?
What Is Power BI and How Is It Used in Data Analytics? Businesses generate large amounts of data every day. Sales transactions, customer information, financial
 Skip to content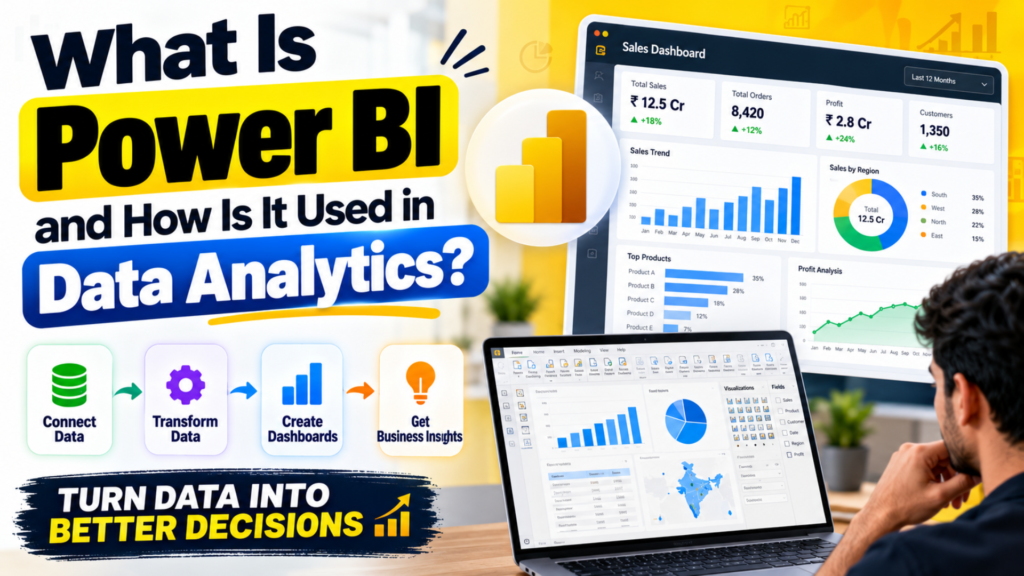
Businesses generate large amounts of data every day. Sales transactions, customer information, financial records, marketing campaigns, website traffic and operational activities all create valuable data. However, raw data alone does not help a business make better decisions. The data needs to be cleaned, analysed and presented in a way that people can understand.
This is where Power BI becomes useful.
Microsoft Power BI is a business intelligence and data visualization platform used to connect data from different sources, transform and analyse that data, and create interactive reports and dashboards. Businesses use Power BI to understand trends, monitor performance, compare results and make data-driven decisions.For students and professionals interested in data analytics, learning Power BI can be an important step toward developing practical data analysis and reporting skills. A structured Power BI course in Ameerpet can help learners understand the complete workflow, from importing data and cleaning it to creating dashboards and presenting business insights.This article explains what Power BI is, where it is used, how it compares with Excel, how dashboards work, what DAX means, and how Power BI skills can support careers in data analytics.
Power BI is a business intelligence platform developed by Microsoft.It allows users to connect data from different sources, prepare the data, build data models, perform calculations and create interactive visual reports.
Instead of looking at thousands of rows in a spreadsheet, users can transform the information into visual reports such as:
Charts
Graphs
Tables
Cards
Maps
KPI indicators
Slicers
Interactive dashboards
For example, imagine a company has sales data for the last three years.
An Excel sheet may contain thousands of records showing:
Product
Customer
Region
Salesperson
Quantity
Revenue
Date
Profit
Power BI can transform this information into an interactive dashboard where management can quickly see:
Total sales
Monthly revenue
Best-performing products
Top sales regions
Salesperson performance
Year-over-year growth
Profit trends
This is one of the main reasons Power BI is widely associated with modern business intelligence and data visualization.
Data analytics is about turning raw information into useful insights.
A typical analytics process can look like this:
Raw Data
↓
Data Cleaning
↓
Data Transformation
↓
Data Modelling
↓
Analysis
↓
Visualization
↓
Business Insights
Power BI can support several stages of this workflow.
It allows users to bring information from different sources, transform it, create relationships between tables, calculate metrics and present the results through interactive reports.
This makes Power BI useful not only for creating attractive dashboards but also for understanding business performance.
Overview of Power BI Service features, including Power BI Premium, Power BI Embedded, and Power BI Report Server.
Accessing help resources, documentation, and online communities for ongoing learning and support.
A basic Power BI workflow can be divided into several stages.
1. Connect to Data
Power BI can connect to different data sources.
Examples include:
Excel
CSV
SQL databases
SharePoint
Web sources
Cloud services
Business applications
The ability to combine information from multiple sources is useful when a company stores data across different systems.
2. Clean and Transform Data
Raw business data is rarely perfect.
It may contain:
Duplicate records
Missing values
Incorrect formats
Unnecessary columns
Inconsistent names
Incorrect data types
Power BI uses Power Query to help users clean and transform data.
For example, a sales dataset may contain dates in different formats.
Power Query can help standardize those values before the data is used for analysis.
3. Build a Data Model
Once the data is cleaned, tables can be connected through relationships.
For example:
Sales Table
can connect to:
Product Table
Customer Table
Date Table
Employee Table
This creates a data model that allows users to analyse information across different dimensions.
4. Create Calculations
Power BI uses DAX, or Data Analysis Expressions, for creating calculations and measures.
For example, users can calculate:
Total Sales
Total Profit
Profit Margin
Average Sales
Year-to-Date Sales
Previous Year Sales
Growth Percentage
These calculations help turn raw data into meaningful business metrics.
5. Build Reports and Dashboards
The final step is presenting the results visually.
Users can create:
Bar charts
Line charts
Pie charts
Tables
Matrix reports
Cards
KPI visuals
Maps
Slicers
These visuals can interact with each other, allowing users to explore the data dynamically.
Power BI can be used across many industries and business functions.
Sales Analytics
Sales teams can use Power BI to track:
Revenue
Sales targets
Product performance
Regional performance
Salesperson performance
Monthly growth
A sales dashboard can help managers identify which products and regions are generating the most revenue.
Finance Analytics
Finance teams can use Power BI for:
Revenue analysis
Expense tracking
Budget comparison
Profit analysis
Cash-flow reporting
Financial KPIs
Instead of manually preparing recurring reports, analysts can create reusable dashboards.
Marketing Analytics
Marketing teams generate data from many channels.
Power BI can help analyse:
Campaign performance
Website traffic
Leads
Conversion rates
Marketing costs
Customer acquisition
This allows marketers to compare campaigns and identify which activities generate better results.
Human Resources Analytics
HR departments can create reports for:
Employee headcount
Department-wise employees
Attrition
Hiring
Attendance
Employee demographics
Recruitment performance
An HR dashboard can help management identify workforce trends.
Operations Analytics
Operations teams can analyse:
Production
Inventory
Delivery
Procurement
Operational costs
Productivity
This can help companies identify inefficiencies and improve operational performance.
A Power BI dashboard is a visual interface that presents important business information in one place.Instead of reading multiple spreadsheets or reports, users can see important KPIs through interactive visualizations.
For example, a sales dashboard could display:
Total Revenue
₹25.4 Cr
Total Orders
18,250
Average Order Value
₹13,900
Growth
+18%
Below these KPIs, charts could display:
Monthly sales
Sales by region
Sales by product
Top customers
Sales trends
Users can then interact with filters to explore the information.
Excel is still one of the most widely used tools for working with data.
So why learn Power BI?
The two tools can work together rather than being complete replacements for one another.
| Excel | Power BI |
|---|---|
| Excellent for spreadsheets | Designed for BI and reporting |
| Useful for calculations | Strong interactive visualization |
| Suitable for smaller analysis tasks | Useful for larger analytical workflows |
| Flexible cell-based work | Model-based data analysis |
| Manual report creation is common | Interactive reports can be refreshed |
| Spreadsheet-focused | Dashboard and analytics-focused |
Excel remains valuable, especially for data preparation and individual analysis.
Power BI adds another layer for data modelling, visualization and interactive reporting.
This is why professionals who understand both Excel and Power BI can develop a broader analytics skill set.
For beginners, moving from Excel to Power BI can be easier if they already understand basic spreadsheet concepts.
A useful progression is:
Excel Fundamentals
↓
Advanced Excel
↓
Power Query
↓
Power BI
↓
DAX
↓
Data Modelling
↓
Interactive Dashboards
This doesn’t mean Excel is mandatory before Power BI.
A beginner can learn Power BI directly.
However, familiarity with spreadsheets, formulas, tables and basic data concepts can make the learning process easier.
Power Query is used for importing, cleaning and transforming data.
Imagine receiving a sales file every month.
The file may contain:
Blank rows
Duplicate entries
Incorrect dates
Unnecessary columns
Inconsistent product names
Instead of manually cleaning the data every month, Power Query can help automate many transformation steps.
Common Power Query operations include:
Removing duplicates
Filtering rows
Splitting columns
Merging tables
Appending datasets
Changing data types
Replacing values
Creating calculated columns
This makes Power Query an important part of the Power BI learning process.
DAX stands for Data Analysis Expressions.It is a formula language used in Power BI for creating calculations and measures.Beginners can start with simple calculations before moving to more advanced concepts.
For example:
Total Sales
can be calculated from a sales column.
More advanced calculations can include:
Year-to-date sales
Previous year sales
Growth percentage
Running totals
Average sales
Profit margin
DAX becomes particularly important when users need calculations that respond dynamically to filters and report selections.
Anyone planning to learn Power BI should understand these important concepts:
Data Sources
Where the information comes from.
Power Query
Used for data transformation and cleaning.
Data Model
Defines relationships between tables.
Measures
Calculations used for reporting and analysis.
DAX
Formula language for analytical calculations.
Visualizations
Charts and other methods used to present information.
Filters
Used to focus analysis on specific data.
Slicers
Interactive controls that allow report users to filter information.
Reports
Collections of interactive report pages.
Dashboards
High-level visual views of important information. Understanding these concepts creates a strong foundation for Power BI.
Learning Power BI becomes more meaningful when students understand how companies use it.
Use Case 1: Sales Dashboard
A company can combine sales records and create a dashboard showing:
Monthly revenue
Regional sales
Product performance
Customer performance
Sales targets
Management can use this dashboard to identify trends.
Use Case 2: HR Dashboard
An HR dashboard can show:
Total employees
New hires
Attrition
Department headcount
Attendance
Recruitment status
This helps HR teams monitor workforce information.
Use Case 3: Finance Dashboard
A finance dashboard can compare:
Actual vs Budget
and display:
Revenue
Expenses
Profit
Budget variance
Monthly trends
This can make financial reporting easier to understand.
Use Case 4: Marketing Dashboard
Marketing teams can combine campaign information and create reports showing:
Leads
Campaign spend
Conversions
Cost per lead
Conversion rate
Channel performance
This allows marketers to identify high-performing campaigns.
Project-based learning is one of the best ways to develop practical Power BI skills.
Students can create:
1. Sales Dashboard
Include:
Revenue
Profit
Orders
Products
Regions
Sales trends
2. HR Analytics Dashboard
Include:
Employee count
Attrition
Department
Hiring
Employee trends
3. Finance Dashboard
Include:
Revenue
Expenses
Profit
Budget
Variance
4. E-Commerce Dashboard
Include:
Orders
Customers
Products
Revenue
Average order value
Regional sales
5. Marketing Analytics Dashboard
Include:
Campaigns
Leads
Spend
Conversions
ROI
These projects can also become useful additions to a student’s portfolio.
Power BI is one part of a broader data analytics skill set.
Students interested in analytics should also consider learning:
Excel
SQL
Power Query
DAX
Data visualization
Data modelling
Basic statistics
Business communication
Depending on the career path, additional tools such as Python or other analytics platforms may also be useful.
The objective should be to develop the ability to move from:
Data → Analysis → Insight → Business Decision
Power BI skills can be relevant to several roles.
Potential career paths include:
Data Analyst
Business Analyst
BI Analyst
Reporting Analyst
MIS Analyst
Business Intelligence Developer
Data Visualization Analyst
Junior Data Analyst
The exact responsibilities vary between companies.
For example, a Reporting Analyst may focus heavily on dashboards and recurring reports, while a Data Analyst may combine Power BI with SQL, Excel and statistical analysis.
Students searching for a Power BI course in Ameerpet should look beyond the number of topics mentioned in a course brochure.A good course should provide practical exposure to the complete analytics workflow.
Look for training that covers:
Power BI fundamentals
Data import
Power Query
Data cleaning
Data modelling
Relationships
DAX
Data visualization
Dashboard development
Real-world datasets
Projects
Report presentation
Practical assignments are particularly important because dashboard development requires hands-on experience.
Hyderabad has a growing ecosystem of IT, business services and analytics-related opportunities.Students looking for Power BI training in Hyderabad can benefit from learning through practical datasets rather than only theoretical lessons.A structured course should help learners understand how to take a raw dataset and convert it into a useful report.
The workflow should look something like:
Raw Excel/CSV Data
↓
Power Query
↓
Clean Data
↓
Data Model
↓
DAX Measures
↓
Visualizations
↓
Power BI Dashboard
↓
Business Insights
This is the type of workflow students should practise repeatedly.
Learning Power BI effectively requires more than watching tutorials. Students need opportunities to work with datasets, build dashboards and understand how business questions are converted into analytical reports.JBK Academy can help learners develop Power BI skills through a structured, practical learning approach.
Practical Power BI Learning
Students can practise the complete workflow from importing data to creating dashboards.
Data Visualization Skills
Learn how to select appropriate charts and present information clearly.
Power BI Dashboards
Work on interactive dashboards that demonstrate practical reporting skills.
Power Query and Data Cleaning
Understand how raw data can be prepared before analysis.
DAX Fundamentals
Develop an understanding of calculations and measures used in Power BI.
Real-World Projects
Projects can help students move beyond theory and practise analytics workflows.
Career-Focused Learning
A practical Power BI portfolio can provide examples to discuss during interviews for entry-level analytics and reporting roles.For students looking for a Power BI course in Ameerpet, JBK Academy can be considered as an option for developing practical business intelligence and data analytics skills.
1. What is Power BI used for?
Power BI is used for data analysis, business intelligence, reporting and data visualization. It helps users connect to data, clean and transform it, create calculations, build reports and analyse business performance through interactive dashboards.
2. Is Power BI a data analytics tool?
Yes. Power BI is widely used as a business intelligence and data analytics tool, particularly for data modelling, reporting and visualization.
3. Is Power BI better than Excel?
Power BI and Excel serve different purposes. Excel is highly useful for spreadsheets and individual analysis, while Power BI is designed for interactive reporting, data modelling and business intelligence. Many professionals use both.
4. Do I need Excel before learning Power BI?
No. Excel is not mandatory, but basic knowledge of spreadsheets and data can make Power BI easier to understand.
5. What is DAX in Power BI?
DAX stands for Data Analysis Expressions. It is a formula language used to create calculations and measures in Power BI.
6. What is Power Query?
Power Query is a data transformation tool used to import, clean and prepare data before analysis.
7. Can freshers learn Power BI?
Yes. Freshers can learn Power BI by starting with basic data concepts and gradually learning Power Query, data modelling, DAX, visualization and dashboard development.
8. What projects should I build in Power BI?
Sales, HR, finance, marketing and e-commerce dashboards are good beginner-to-intermediate projects. They allow learners to practise different analytical scenarios.
9. Is Power BI useful for data analyst jobs?
Power BI can be useful for data analyst, reporting analyst, BI analyst and business analyst roles. It is particularly valuable when combined with skills such as Excel, SQL, data modelling and business communication.
10. Where can I learn Power BI in Hyderabad?
Students can explore Power BI training options in areas such as Ameerpet and Dilsukhnagar. When selecting a course, look for practical projects, Power Query, DAX, data modelling and dashboard development rather than only theoretical instruction.
Power BI is more than a tool for creating charts.It provides a workflow for transforming raw business data into understandable information.
The process can be summarized as:
Connect Data → Clean Data → Model Data → Calculate → Visualize → Analyse → Share Insights
For students and professionals entering data analytics, learning this workflow can provide a practical foundation for business intelligence and reporting.A structured Power BI course in Ameerpet can help learners develop these skills through hands-on practice, while students looking for Power BI training in Hyderabad or a Power BI course in Ameerpet should focus on practical project work, data modelling, Power Query and DAX.
At JBK Academy, the goal should be to help learners move beyond simply learning software features and develop the ability to answer real business questions with data.The most important skill is not creating the most colourful dashboard.
It is being able to look at data and confidently answer:
“What is happening, why is it happening, and what should the business do next?”
That is where Power BI becomes a valuable tool in modern data analytics.
What Is Power BI and How Is It Used in Data Analytics? Businesses generate large amounts of data every day. Sales transactions, customer information, financial
Power BI vs Advanced Excel: What Should Beginners Learn First? Data is now an important part of almost every business. Companies use sales figures, customer
Tally Course for Beginners: Step-by-Step Roadmap to Learn Accounting Software Learning accounting software can be an important step for students, job seekers, business owners, and
Job-Oriented Accounting Course in Ameerpet: What Students Should Check Before Joining Choosing a job oriented accounting course in Ameerpet is an important decision for students,
Best Computer Courses for Accounting Jobs in Hyderabad If you are looking for an accounting job in Hyderabad, knowing basic computer skills is no longer
Photoshop Course in Hyderabad: Beginner Roadmap for Design and Marketing Photoshop is one of the most widely recognized tools in the creative industry. From social
YouTube Video Editing Course: Skills Needed for Content Creators Creating videos for YouTube is no longer only about recording good footage. Successful creators need to
Video Editing Course in Hyderabad: Skills, Software and Career Opportunities Video has become one of the most powerful forms of digital communication. From YouTube videos
Graphic Designing Course in Hyderabad: Tools, Portfolio and Career Scope Choosing the right graphic designing course in Hyderabad can be an important first step for
Digital Marketing Course in Hyderabad: SEO, Google Ads and Social Media Career Path Choosing the right Digital Marketing course in Hyderabad can be an important
Tally vs Advanced Excel vs SAP FICO vs Power BI: Which Course Should You Choose? Choosing between Tally, Advanced Excel, SAP FICO, and Power BI
Accounting Course for Career Gap Candidates and Homemakers: Restart Roadmap Returning to work after a career break can feel challenging, especially when technology, workplace expectations,
MS Office Course in Ameerpet: Basic Computer Skills for Office Jobs In today’s workplace, basic computer knowledge is no longer an optional skill. Whether you
ITR and GST Tax Practitioner Course: How to Start a Tax Filing Career Taxation is an essential part of every business and financial system. Individuals
SAP FICO After Tally: Best Learning Path for Accountants For students and accounting professionals planning to build a career in finance, learning Tally first and
Zoho Books Course in Hyderabad: Cloud Accounting Skills for Freshers The shift from traditional accounting to cloud-based financial management has created new opportunities for students,
Advanced Excel and Tally Course: Best Skill Combination for Accounting Jobs Accounting has evolved significantly over the past decade. Businesses no longer rely solely on
Best Accounting Courses After 12th or Graduation in Hyderabad Start Your Career with the Best Accounting Course in Hyderabad Choosing the right career after completing
Tally Prime with GST Course: Complete Practical Syllabus for Beginners Accounting is one of the most stable and in-demand career fields in today’s business world.
Power BI Course for Accounting and Finance Students: Dashboard Skills Roadmap Introduction to Power BI Overview of Power BI and its capabilities. Installation and setup